Basic features
The following screenshot shows the home dashboard with the common controls.
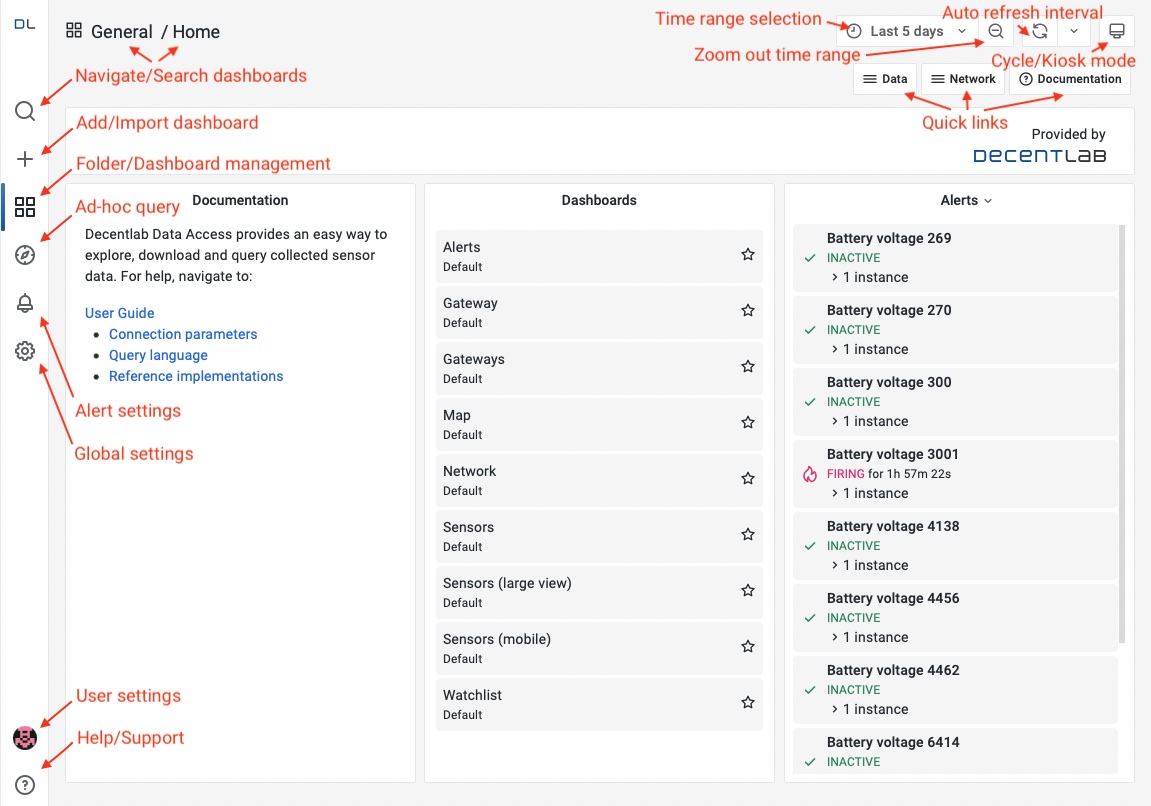
Time range selection
The options here set the time range of the displayed data. You may specify a From - To period or select one of the predefined Quick ranges. Time range can also be adjusted by clicking the mouse button and dragging horizontally over a graph. The zoom out button (or a double click on the panel) is useful for navigating to a broader time range.
Auto refresh interval
The data can be refreshed using the reload data button. Additionally, one can set auto refresh interval here.
Selecting data
You can choose the displayed data related to particular devices, sensors, and channels. The panels will then be dynamically created according to the selection.
Aggregate functions
Data aggregation (or data alignment) options define how raw data points are processed before being displayed. When you select a function in the Aggregate by field, the function is applied to raw data points grouped by the Aggregate interval period. Then new data points are shown for every group lying within the defined time range.
By default, the mean function is applied to the groups formed by the auto aggregation interval. The auto option dynamically sets the aggregation interval based on the selected time range to adjust the number of data points to be rendered. If the aggregation interval is set to too small, a large number of data points may slow down the browser’s rendering process. Such a scenario can be seen at the end of the screencast below.
Default dashboards
Sensors
Sensors and Sensors (large view) show all sensor data excluding network related information. In this dashboard, each panel is dedicated to a group of identical sensors, e.g., the battery panel shows battery data (voltage) of all selected devices. Suitable for viewing overall sensor data.
Sensors (mobile)
Sensors (mobile) is same as the Sensors dashboard except that each panel shows data from a specific physical sensor, i.e., a panel displays only a single time series. Suitable for investigating individual sensor data when the screen size is small.
Network
Here, the network related information can be investigated. Using the aggregate functions such as count and sum, one can flexibly examine the network status.
Watchlist
This dashboard shows the last sensor value in a table. Useful for field deployment or sensor testing to check the last value in real time.
Map
Map panel can show device or sensor values on a map according to the defined location metadata (see Settings). The following screencast shows defining location data for a device 269 in Global Settings. The meta data used for the example:
{
  "269": {
    "latitude": 51,
    "longitude": 8,
    "name": "269 Station 5"
  },
  "270": {
    "latitude": 51.1,
    "longitude": 8.2,
    "name": "270 Station 7"
  }
}
Note
The map displays only devices of which the location coordinates have been defined.
Gateway/Gateways
If you have registered LoRaWAN gateways with us, you can check their status here. Currently, TTIG status cannot be shown in the dashboard.
Advanced features
User dashboard
One can build various kinds of custom dashboards in the personal directory. A good starting point is to modify the default dashboards.
The dashboards in Default folder cannot be modified in place. Instead, you can save a copy of the dashboard in the personal directory and modify according to your needs.
Global/Personal settings
Following settings can be changed either in the user or global profile:
Timezone
Home dashboard (the dashboard must be starred beforehand)
Theme color
Metadata
The user settings take precedence if different values are set in the both profiles. The following screencast shows accessing user and global settings, and how the user setting takes precedence.
Note
Changing a global setting will affect the others including the public (not logged in) user experience.
User-defined names
The default names of devices or sensors can be overridden in the dashboards via the metadata setting. The metadata used in the example:
{
  "269": {
    "name": "269 Station 5"
  },
  "battery": {
    "name": "Battery Voltage"
  },
  "battery [V]": {
    "name": "Battery Voltage [V]"
  }
}